Structure from motion
Visualize a sparse reconstruction by COLMAP, a general-purpose Structure-from-Motion (SfM) and Multi-View Stereo (MVS) pipeline with a graphical and command-line interface
Background background
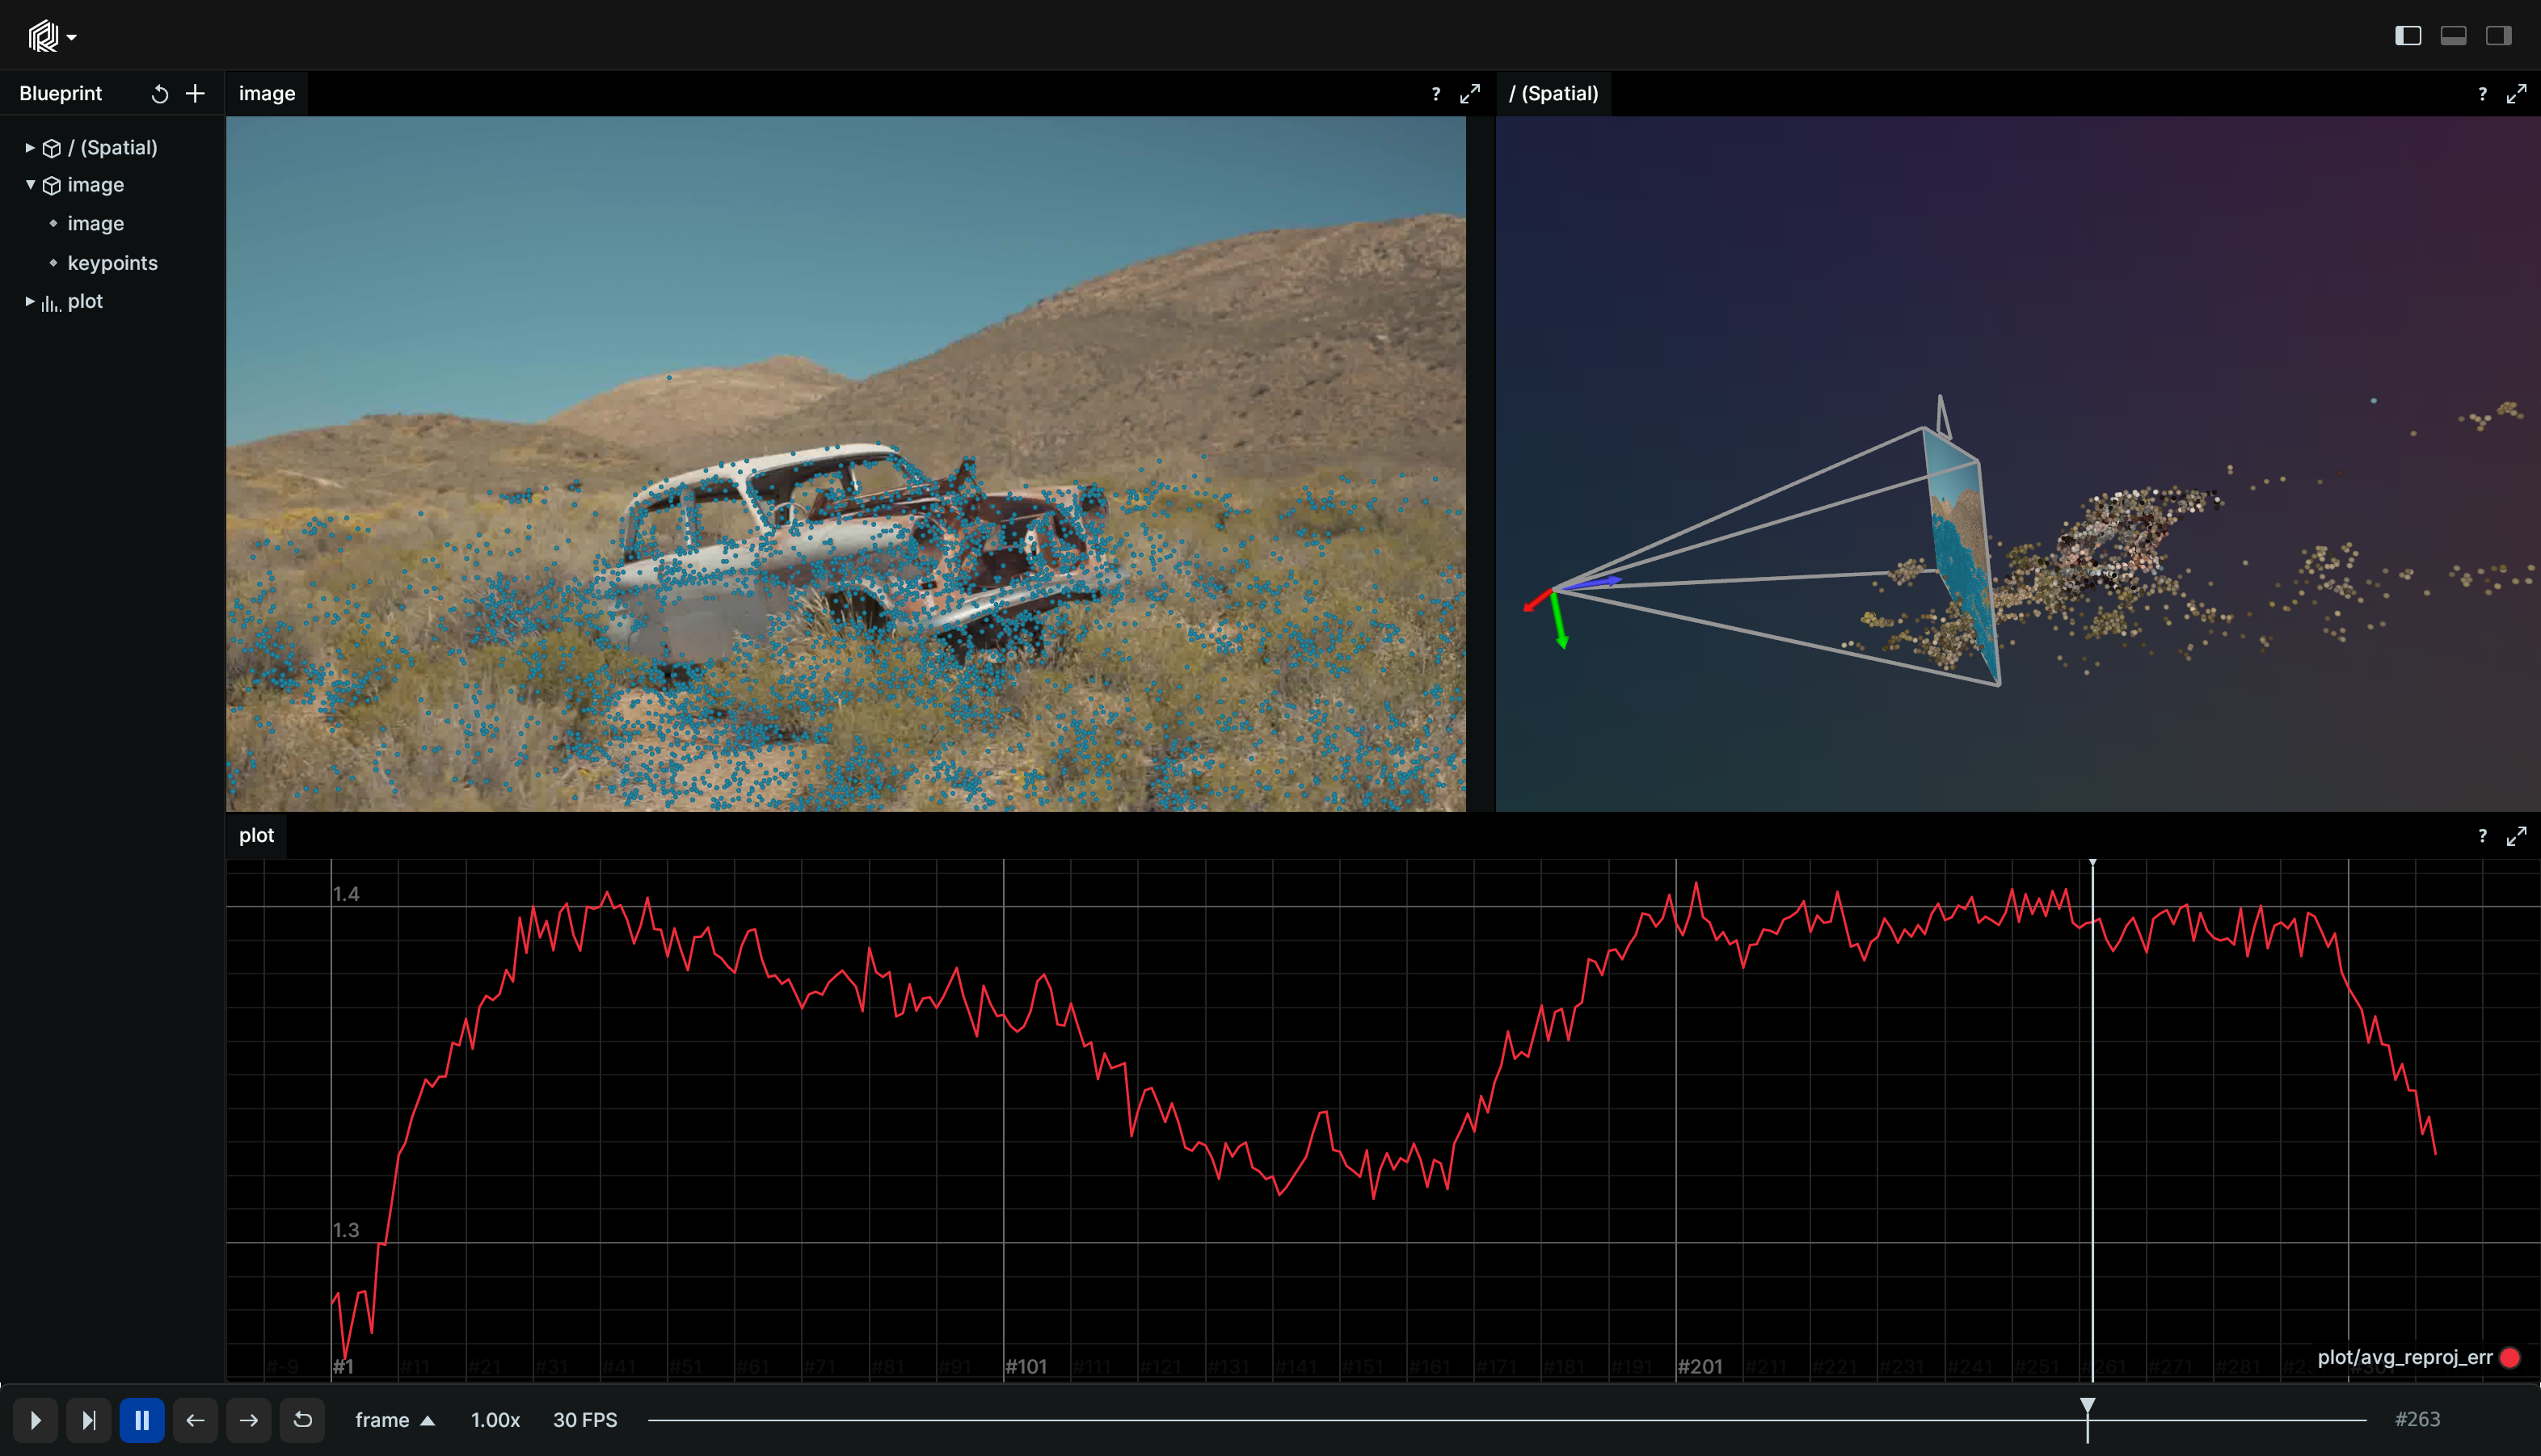
COLMAP is a general-purpose Structure-from-Motion (SfM) and Multi-View Stereo (MVS) pipeline. In this example, a short video clip has been processed offline using the COLMAP pipeline. The processed data was then visualized using Rerun, which allowed for the visualization of individual camera frames, estimation of camera poses, and creation of point clouds over time. By using COLMAP in combination with Rerun, a highly-detailed reconstruction of the scene depicted in the video was generated.
Used Rerun types used-rerun-types
Points2D, Points3D, Transform3D, SeriesLine, Scalar, Pinhole, Image, TextDocument
Logging and visualizing with Rerun logging-and-visualizing-with-rerun
The visualizations in this example were created with the following Rerun code:
Timelines timelines
All data logged using Rerun in the following sections is connected to a specific frame.
Rerun assigns a frame id to each piece of logged data, and these frame ids are associated with a timeline.
rr.set_time_sequence("frame", frame_idx)Images images
The images are logged through the Image to the camera/image entity.
rr.log("camera/image", rr.Image(rgb).compress(jpeg_quality=75))Cameras cameras
The images stem from pinhole cameras located in the 3D world. To visualize the images in 3D, the pinhole projection has to be logged and the camera pose (this is often referred to as the intrinsics and extrinsics of the camera, respectively).
The Pinhole is logged to the camera/image entity and defines the intrinsics of the camera.
This defines how to go from the 3D camera frame to the 2D image plane. The extrinsics are logged as an
Transform3D to the camera entity.
rr.log("camera", rr.Transform3D(translation=image.tvec, rotation=rr.Quaternion(xyzw=quat_xyzw), from_parent=True))rr.log(
"camera/image",
rr.Pinhole(
resolution=[camera.width, camera.height],
focal_length=camera.params[:2],
principal_point=camera.params[2:],
),
)Reprojection error reprojection-error
For each image a Scalar archetype containing the average reprojection error of the keypoints is logged to the
plot/avg_reproj_err entity.
rr.log("plot/avg_reproj_err", rr.Scalar(np.mean(point_errors)))2D points 2d-points
The 2D image points that are used to triangulate the 3D points are visualized by logging as Points2D
to the camera/image/keypoints entity. Note that these keypoints are a child of the
camera/image entity, since the points should show in the image plane.
rr.log("camera/image/keypoints", rr.Points2D(visible_xys, colors=[34, 138, 167]))3D points 3d-points
The colored 3D points were added to the visualization by logging the Points3D archetype to the points entity.
rr.log("points", rr.Points3D(points, colors=point_colors), rr.AnyValues(error=point_errors))Run the code run-the-code
To run this example, make sure you have the Rerun repository checked out and the latest SDK installed:
pip install --upgrade rerun-sdk  # install the latest Rerun SDK
git clone git@github.com:rerun-io/rerun.git  # Clone the repository
cd rerun
git checkout latest  # Check out the commit matching the latest SDK release
Install the necessary libraries specified in the requirements file:
pip install -e examples/python/structure_from_motionTo experiment with the provided example, simply execute the main Python script:
python -m structure_from_motion # run the exampleIf you wish to customize it, explore additional features, or save it use the CLI with the --help option for guidance:
python -m structure_from_motion --help